


Getting Started
Note: Before we get started with charts, please note that generating charts functionality is only available in the desktop app. If you simply want to copy a chart in excel over, please first delete the chart placeholder and then copy your chart into your desired location
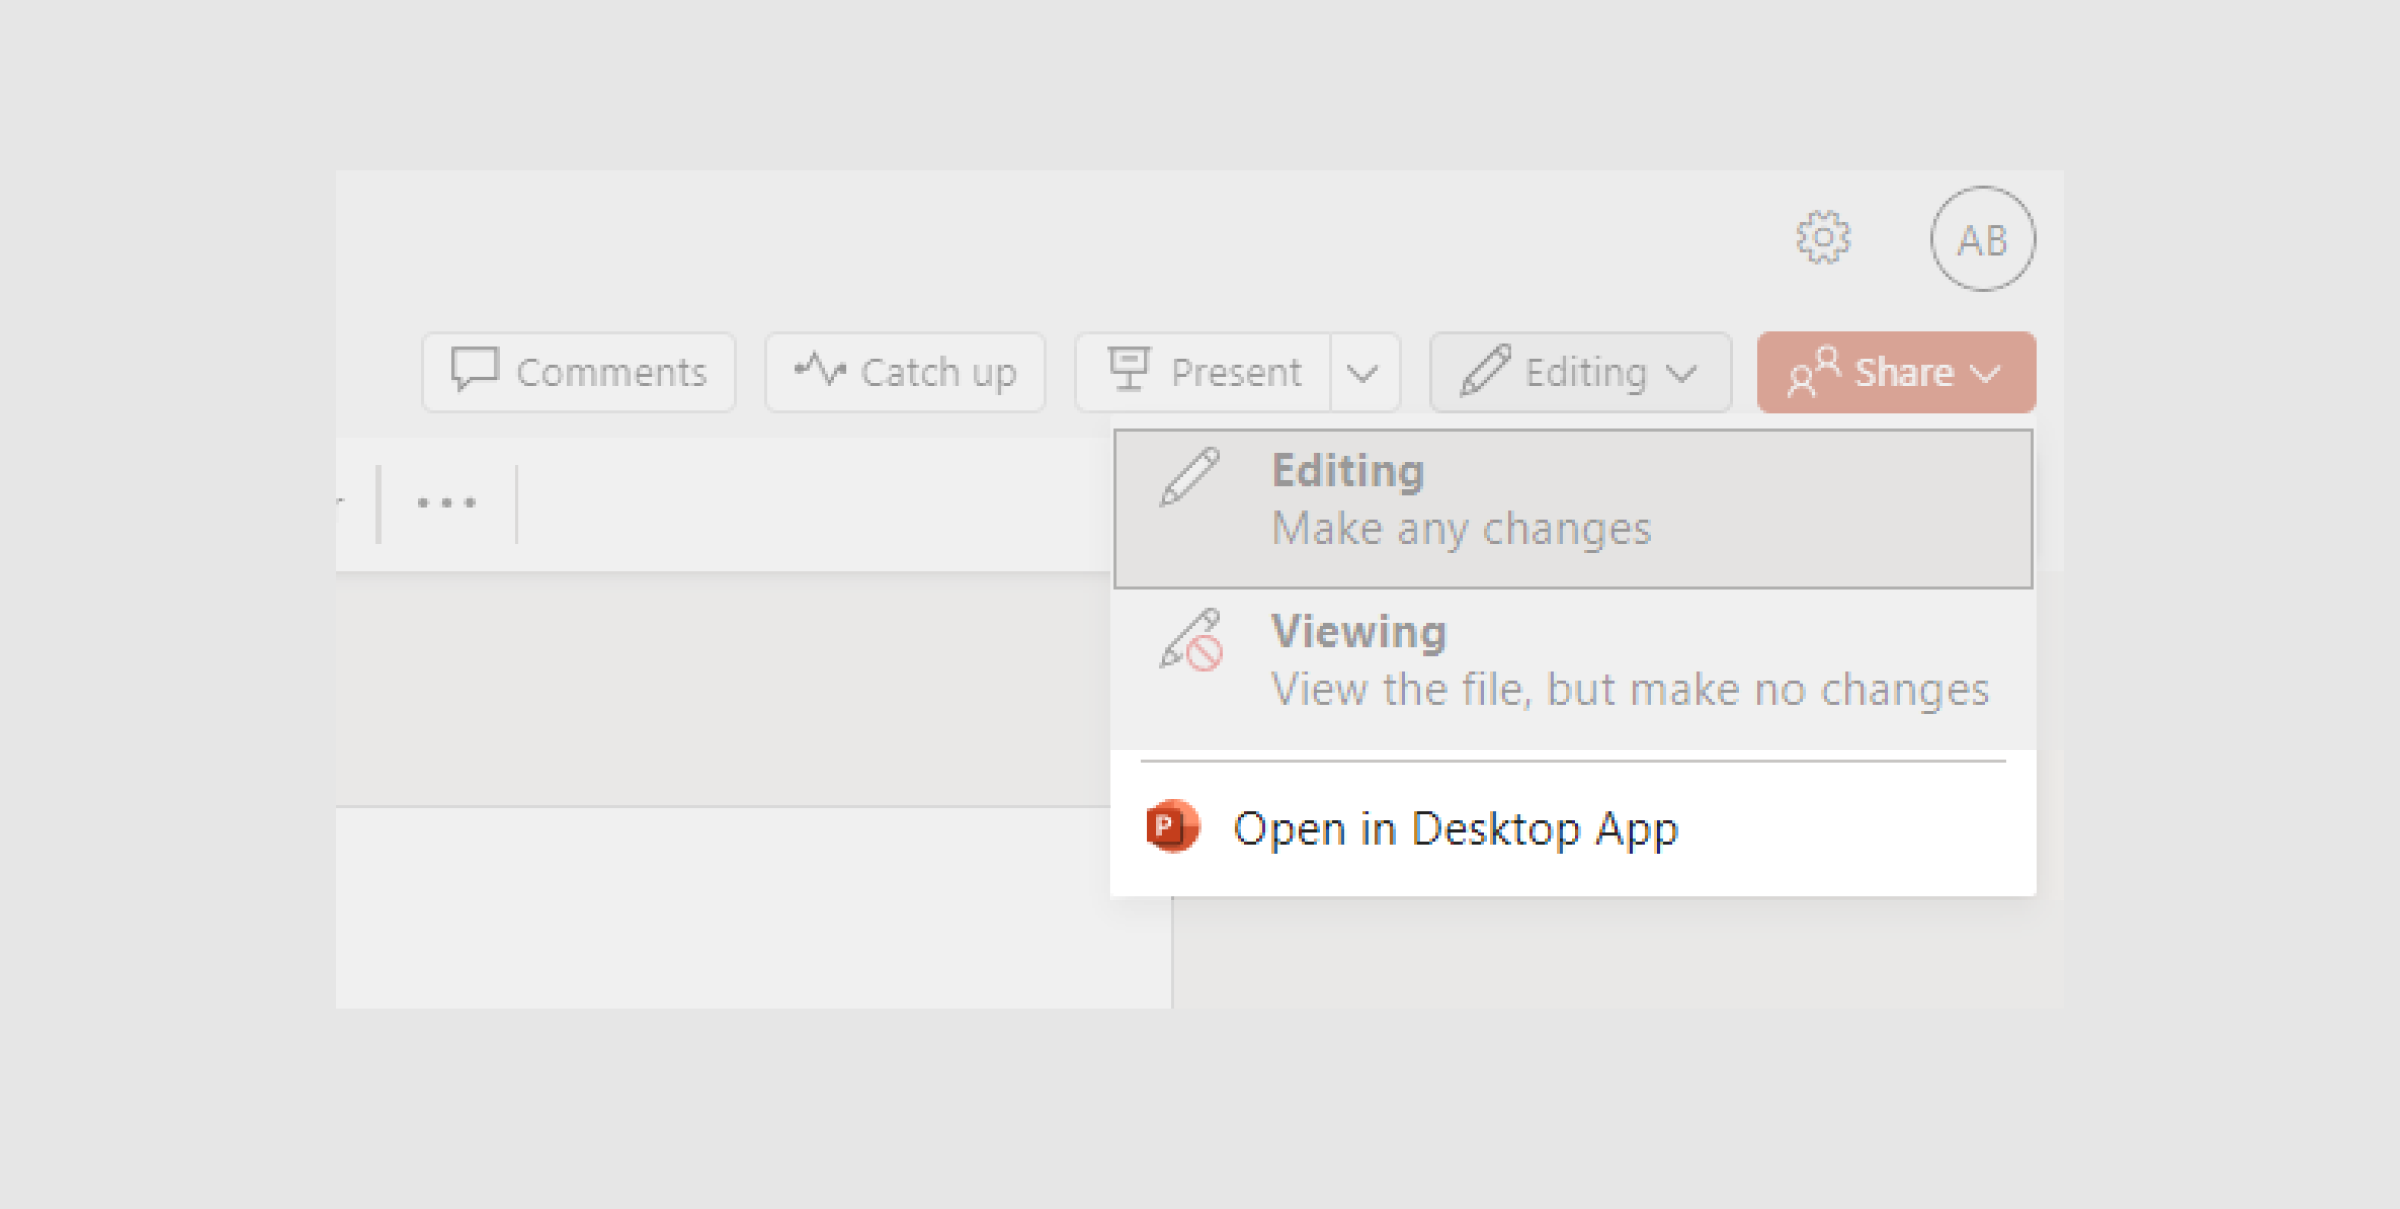
The new presentation templates allow you to create charts directly in PowerPoint, however, this functionality is only available on the desktop app, so if you need to, consider downloading a copy of the file to your computer first. You can also do this by selecting the 'edit in desktop app' option on the web app, as shown below.
Creating Charts
In PowerPoint
You can start creating charts by clicking the chart placeholder. This will prompt you with selecting a chart design - colours will automatically be the 55/R colours - and will then open a mini excel document with your data.
From here, you can populate the data from another excel sheet, and the chart will automatically update based on that data.
Bringing Charts From Excel
If you want to bring charts over directly from excel, please ensure you are first using the 55/Redefined colours. Once your chart is ready, just copy and paste it directly into the PowerPoint slide. You may have to delete the chart placeholder first.


